We covered how to identify the cause of frame drops or unstable bitrate in the Unstable Bitrate section.
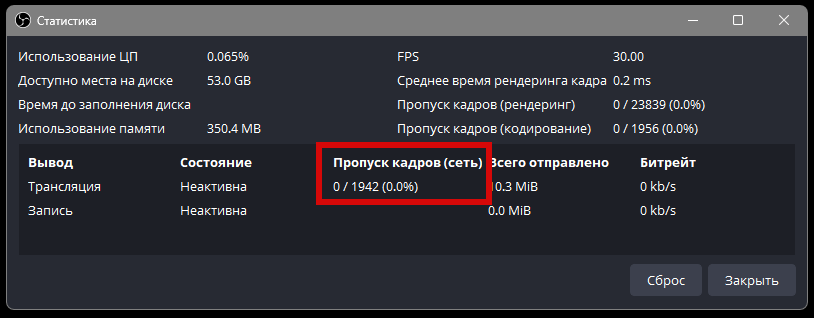
If the Stats panel in OBS shows dropped frames under “Dropped Frames (Network)”, it means there are issues with packet generation or transmission.
To diagnose and resolve these issues, follow the steps below:

Click the Run Ping Tests button.

After that, each server will be pinged. Identify a few with the lowest ping and test your upload speed to them using the Speed Test button.
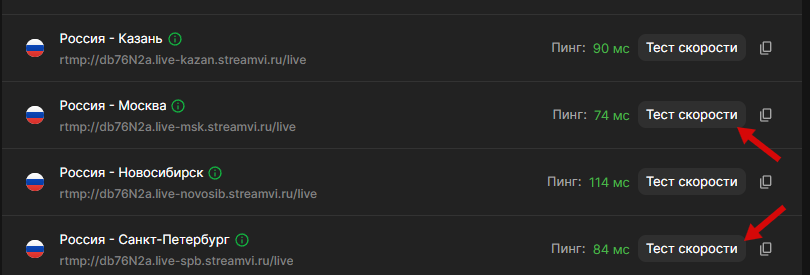
Typically, a ping under 100ms is acceptable, especially when using mobile internet. Wired connections should have lower pings.
Once you click Speed Test, a window with a speed graph will appear.
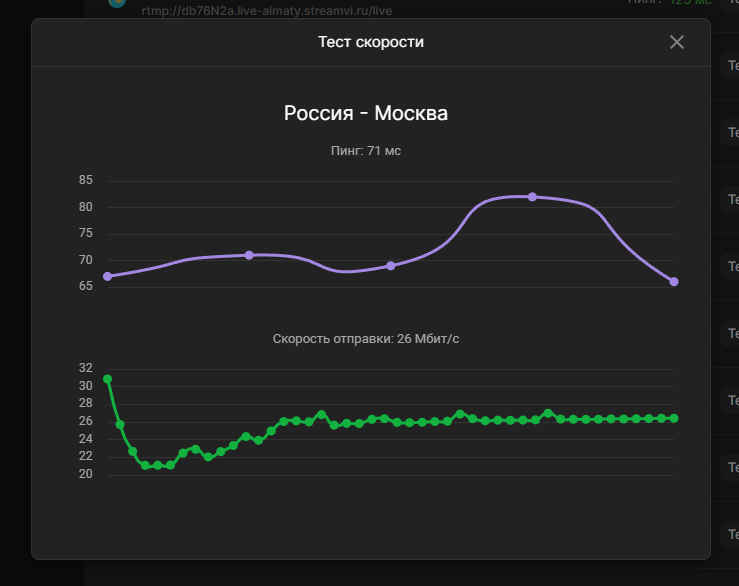
Make sure you select a server for which your upload speed exceeds your set OBS bitrate with a comfortable margin.
You can find your current bitrate setting in OBS under Settings → Output → Bitrate.

If the test result shows an upload speed lower than your set bitrate (e.g., the test shows 22 Mbps but OBS is set to 30,000 Kbps or 30 Mbps), reduce your bitrate to a safe level — for example, 18,000 Kbps. This provides headroom for possible fluctuations in your internet connection.
If you're confident your internet plan provides higher speeds but still experience issues, it's recommended to run a route trace — more on that below.
Important Note:
ISPs typically advertise download speeds, but live streaming depends on upload speeds — these are different values.
You can check your connection speed using speedtest.net, selecting the same region as chosen in StreamVi. However, note that Speedtest displays average speeds, which may vary — sometimes higher, sometimes lower. Also, Speedtest and our service may use different hosting providers and routes (explained below).

Key Detail:
Speedtest results are approximate because it uses small data packets, which don’t reflect full upload channel utilization. Our built-in speed test is more accurate as it uses larger packets and better simulates real streaming conditions.
PingPlotter is a tool that accurately identifies network issues along the route to a server. The free version is sufficient. Download it from: https://www.pingplotter.com
Your internet connection to a game or streaming server passes through many intermediate nodes (routers), forming a route. These nodes may include your local network, your ISP, backbone providers, or data centers.
If any node along the route experiences congestion, delays, or packet loss, it can affect your connection — causing high ping, lag, or disconnections.
PingPlotter traces the route and simultaneously pings each node using ICMP requests, allowing you to see:
Each node is shown as a separate line, allowing you to spot, for example, that ping is stable up to hop 5, but spikes and packet loss begin at hop 6 — this is likely the bottleneck.
To begin, enter the server's address and click “Play”:

The longer PingPlotter runs, the more accurate the results become, capturing data on stability, load spikes, and packet loss. You can run it in the background — it uses minimal bandwidth and doesn't interfere with internet use or other tasks.
Let’s look at a test example where the server is far from your current location:

The graph shows data for each hop, including:
Hops with dashes show 100% packet loss but don’t affect the connection
These nodes ignore ICMP requests (common with firewalls or routers) and don’t affect the next hops. Ignore them unless loss continues beyond.
The first hop is your local router. Latency is normal for local traffic, but not ideal here due to Wi-Fi use.
Hop 15: 36.8% packet loss and increased latency (71.3 ms)
IP: 92.53.93.157 — this node is where the real issues begin:
Always analyze from the top down, addressing problems at the closest possible hop first.
From the trace, we can conclude:
You can use this trace to contact your ISP, pointing out the specific problematic node. Alternatively, send it to our tech support team — we’ll help analyze it and prepare a message for your provider if needed.
PingPlotter includes a handy “Share” → “Create Share Page” feature so you can quickly generate a link to your test results.
